For food and beverage manufacturers, the decision to establish a sensory analysis program in the context of QA/QC activities depends upon business objectives and customer requirements. A successful implementation of a sensory analysis program fits the Plan-Do-Check-Act (PDCA) cycle or Deming wheel. Another model on which to qualify the need for a sensory analysis program is to apply the Hazard Analysis and Critical Control Point (HACCP) method for critical quality point identification. The HACCP principles are increasingly used to develop food quality plans as is the case with SQF level 3 requirements.
PLAN
In previous blog posts, we stressed the importance of sensory methods and product specifications to effective implementation of a sensory program. The ASTM MNL14 standard titled “The role of sensory analysis in quality control” identifies important preliminary steps to a successful project implementation. It also stresses the fact that a sensory program must be part of a Total Quality Management (TQM) approach where the potential loss of product sensory quality is detected early in the process and prevented.
A preliminary assessment will consist of first reviewing existing QA/QC procedures for chemical and physical testing of raw materials (including water), Work In Progress (WIP) and finished products. The audit should focus on material sampling and testing procedures as well as supplier specifications with a focus on lot-to-lot consistency and sensory specifications. Material acceptance/rejection criteria, product hold procedures and related time factors affecting organoleptic quality should also be investigated. The review should also identify previous use of sensory testing.
The second review should include quality records such as customer complaints, frequency of product holds and rework information. Trending on the data will be needed in order to identify patterns and seasonal changes affecting product sensory quality.
Thirdly, a review of the food process will help determine critical areas where sensory measurements must be applied for quality assurance. This can be achieved by conducting an internal audit of storage procedures including First In First Out practices (FIFO), shipping/receiving, storage and handling procedures but also batching/packaging as well as criteria for the procurement of raw materials. Failure to consistently maintain the cold chain, freezer-burnt ingredients, overheated products, odour and taste transfer from the package may all contribute to the perception of off-aromas and flavours in the finished product.
DO and CHECK
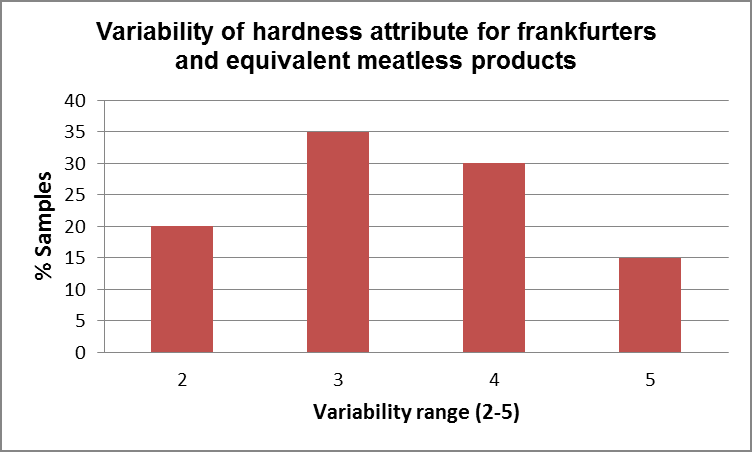
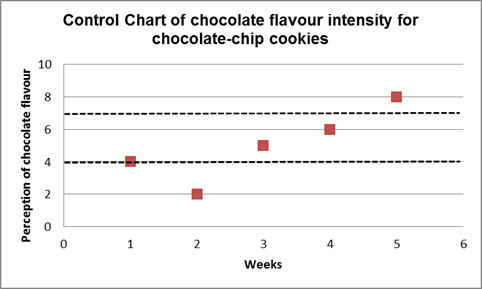
Once the product sensory attributes are established, sensory methods determined and resources allocated, the facility should proceed with testing and reporting results. It is important that senior management be involved by setting and supporting objectives program objectives. Sensory results must be checked against business objectives. The best way to achieve this is to define SMART (Specific, Measurable, Attainable, Realistic, Timely) goals and corresponding KPI (Key Performance Indicators) in order to track progress and ensure the effectiveness of the sensory program. Such objectives may be “X% reduction of customer complaints,”“reduction in positive ‘Different from Control’ sensory test results,” or “decreased product variability.” When executing the program, it is advisable to start targeting easy but key objectives to show the immediate effectiveness of the program. This will be important in obtaining buy-in from staff and support from management. Program effectiveness should be assessed through the reporting of KPIs after a few months of data collection. These validation activities will best be attained by trending and charting sensory and quality data. When graphing sensory data, critical limits for product acceptance or rejection may be established based on marketing input or sensory panel input. When statistics are computed using sensory panel data to establish upper and lower control limits, the best practice is to accept those products within one standard deviation of the mean for each sensory attribute. Examples of control graphs are shown below. Refer to the articles listed under references for additional information regarding texture profiling and sensory variability of food products.
ACT
Based on the review of sensory results, there may be a need to make adjustments to the program. A cost-benefit analysis may also be performed to justify increasing the number of panelists or samples. If the program shows value, it may be refined by altering test procedures and/or sampling procedures. The repeated exposure to the methodologies and products will also make the panel more proficient. If, on the other hand, it is demonstrated that product quality can be determined using existing chemical or physical measurements, a sensory evaluation program may not be required unless requested by the customer. In summary, the collection and analysis of sensory data must be cost-effective. Optimum value is achieved when product non-conformities cannot be detected by instrumental testing alone.
References
Matulis, R. J., McKeith, F. K., Sutherland, J. W., & Brewer, M. S. (1995). Sensory characteristics of frankfurters as affected by fat, salt, and pH. Journal of Food Science, 60(1), 42-47.
Muñoz, A. M. (2002). Sensory evaluation in quality control: An overview, new developments and future opportunities. Food Quality and Preference, 13(6), 329-339.
Szczesniak, A. S. (2002). Texture is a sensory property. Food Quality and Preference, 13(4), 215-225.
